Excel
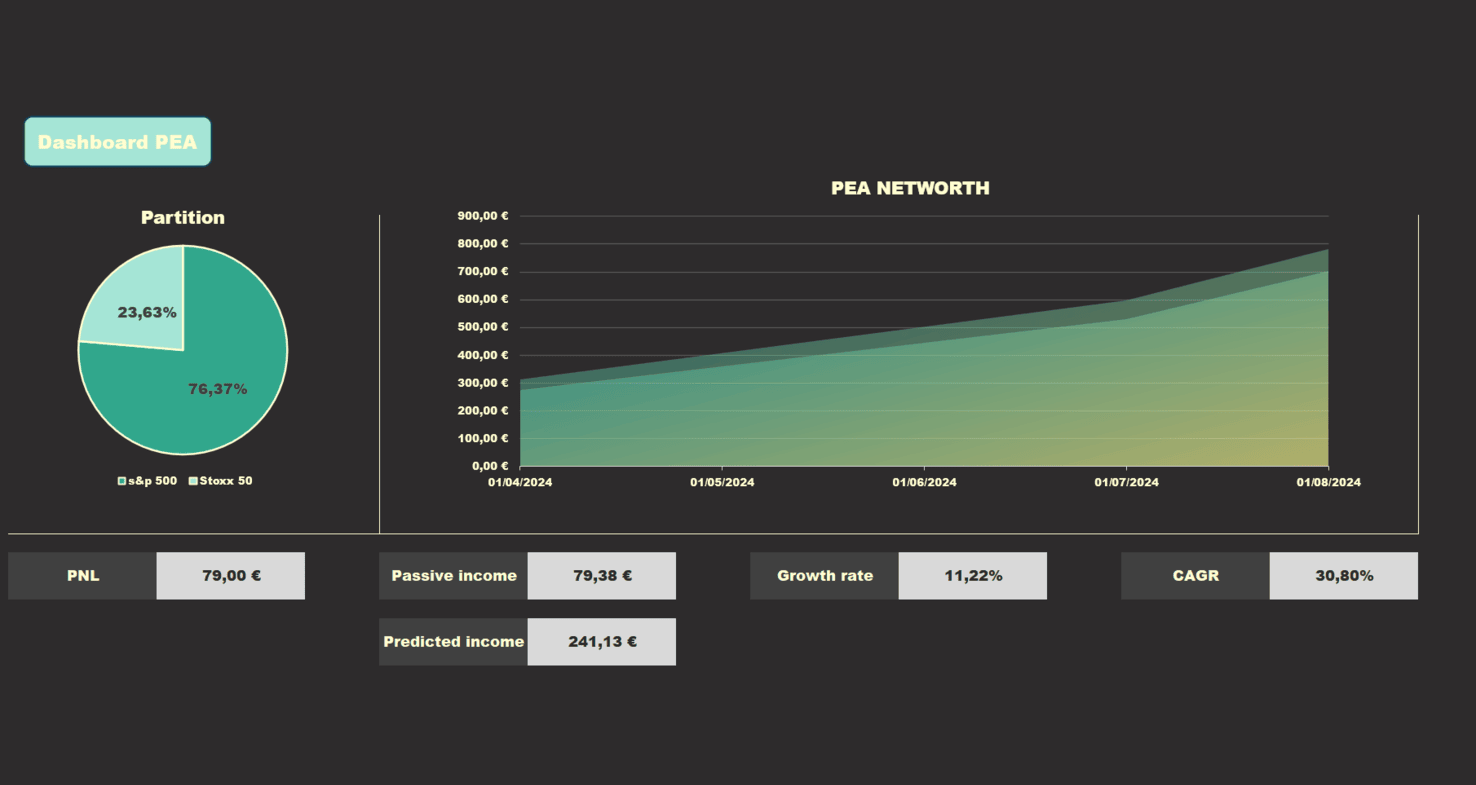
Evolution of PEA over time with some indicators
Distribution of investments
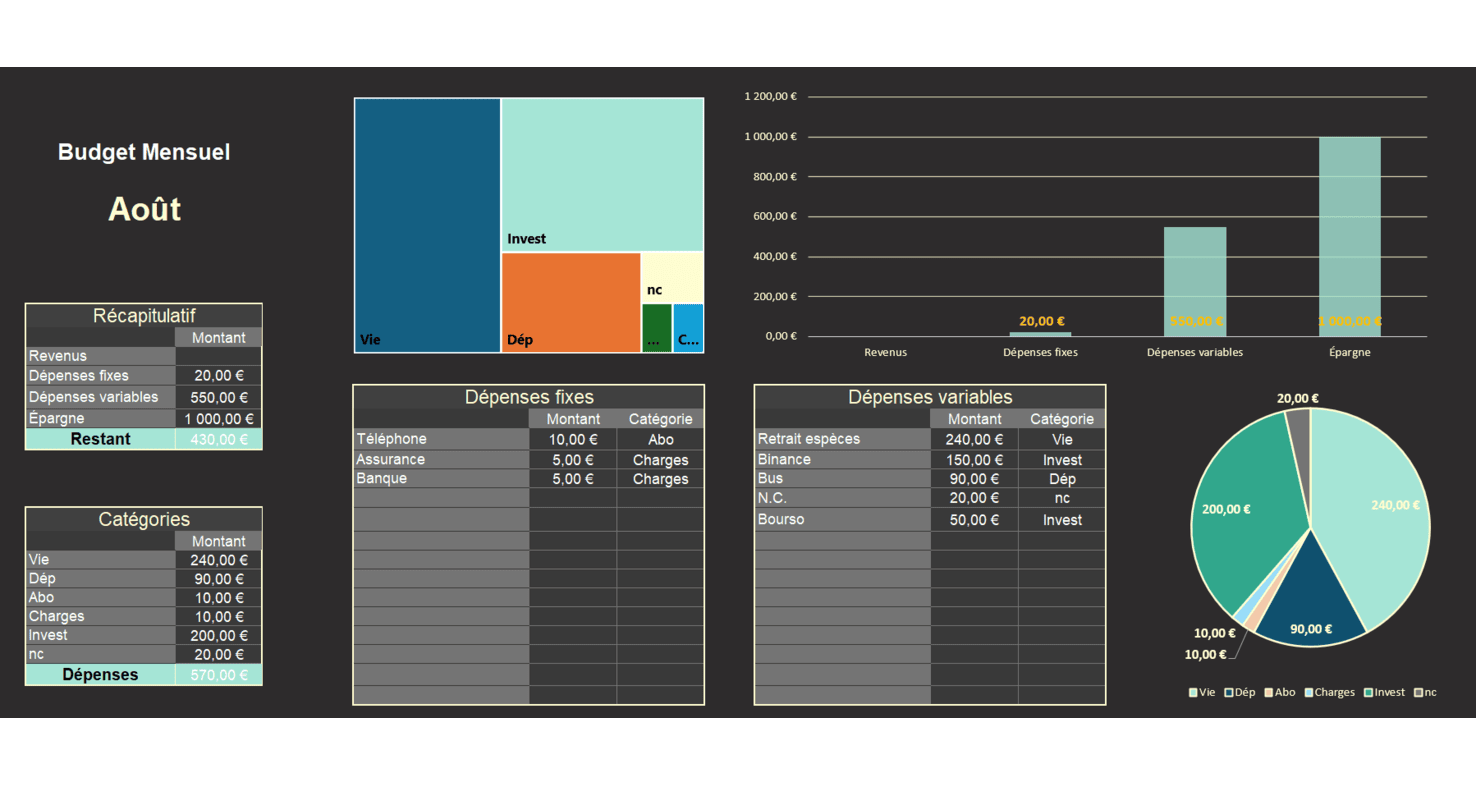
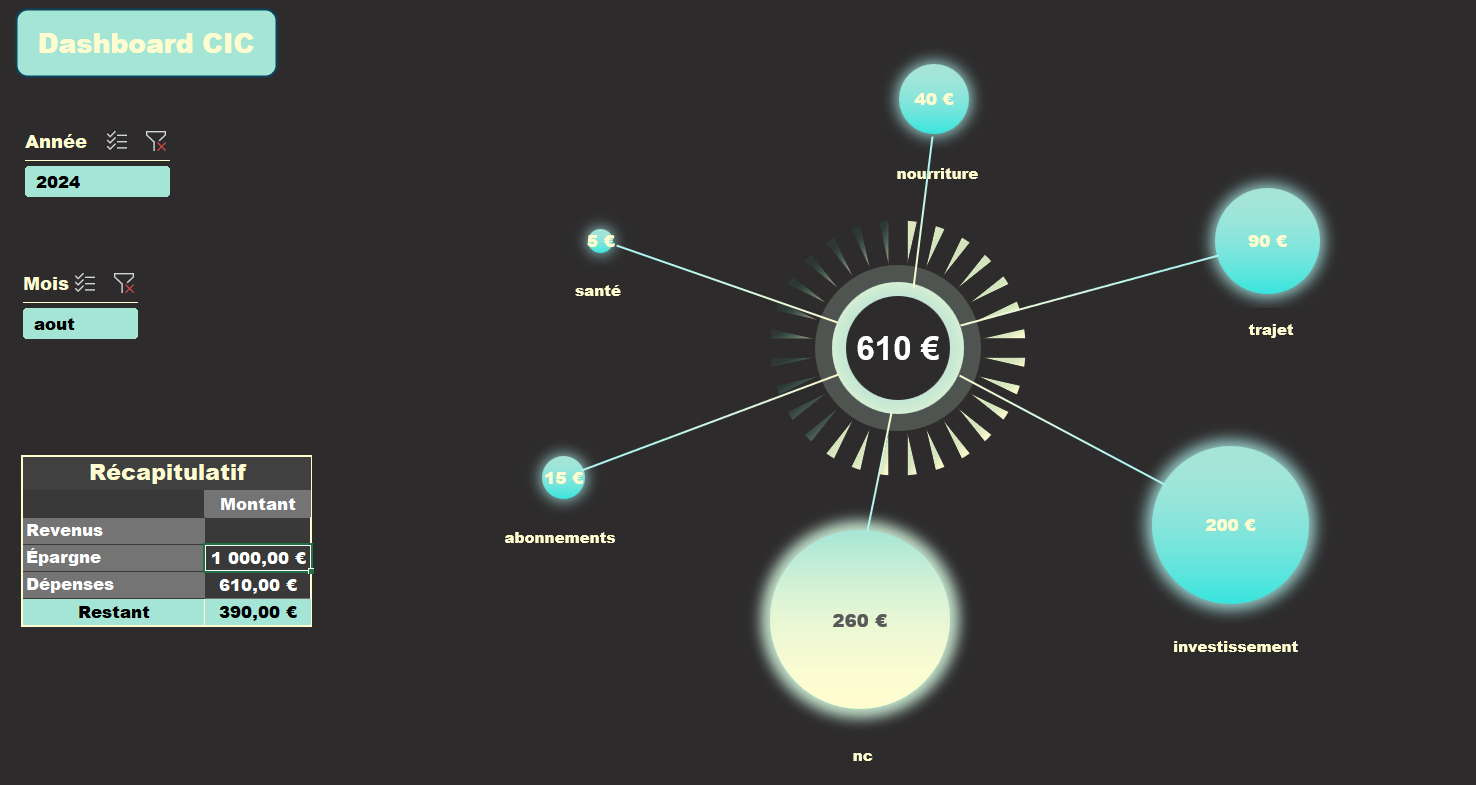
Monthly budget tracking
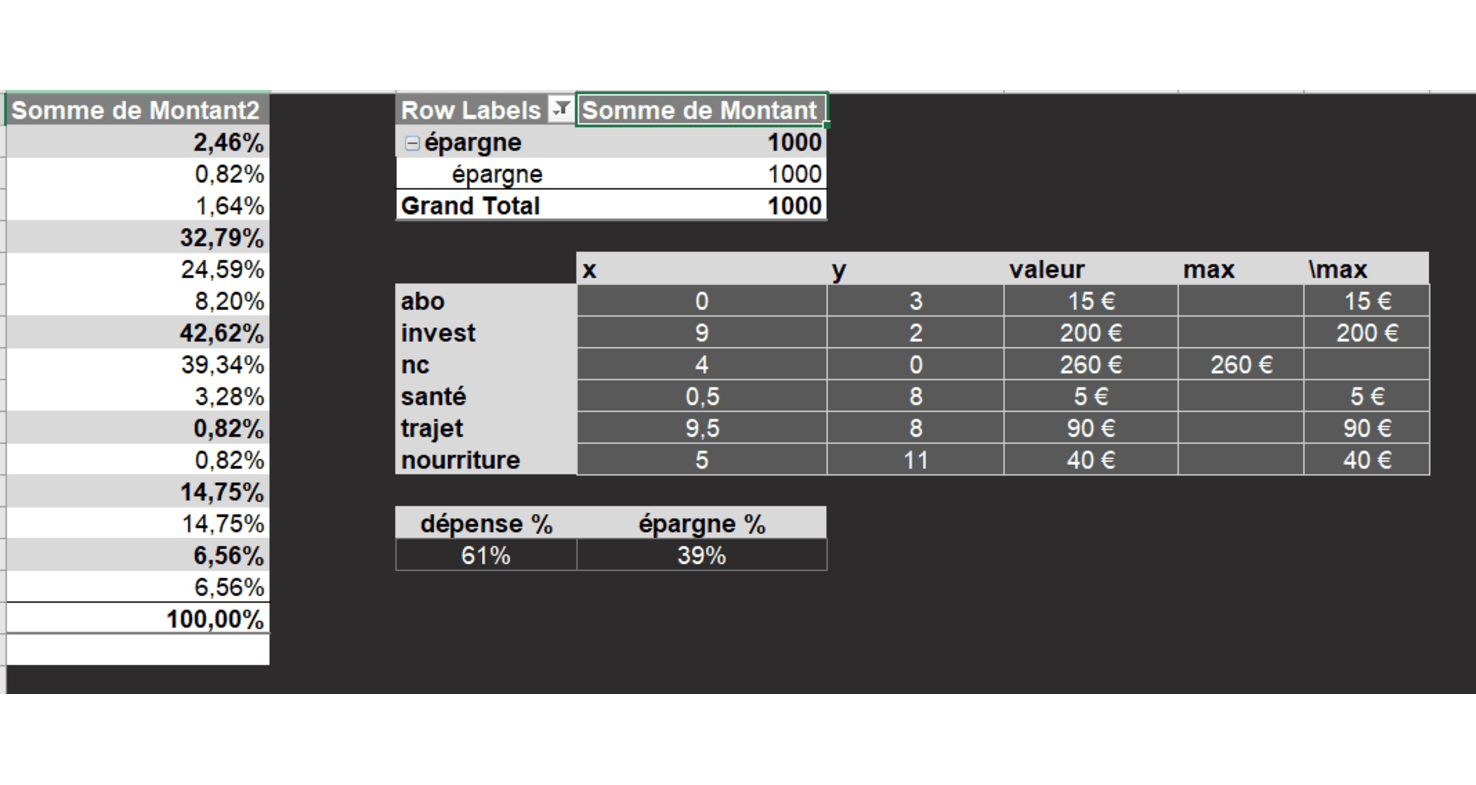
Pivot table to display charts
Data are randomly generated for visualisation
The objective is similar to my Power BI project, but with the added benefit of
Excel's greater flexibility and ease of daily use
Evolution of PEA over time with some indicators
Distribution of investments
Monthly budget tracking
Pivot table to display charts
Data are randomly generated for visualisation