Power Bi
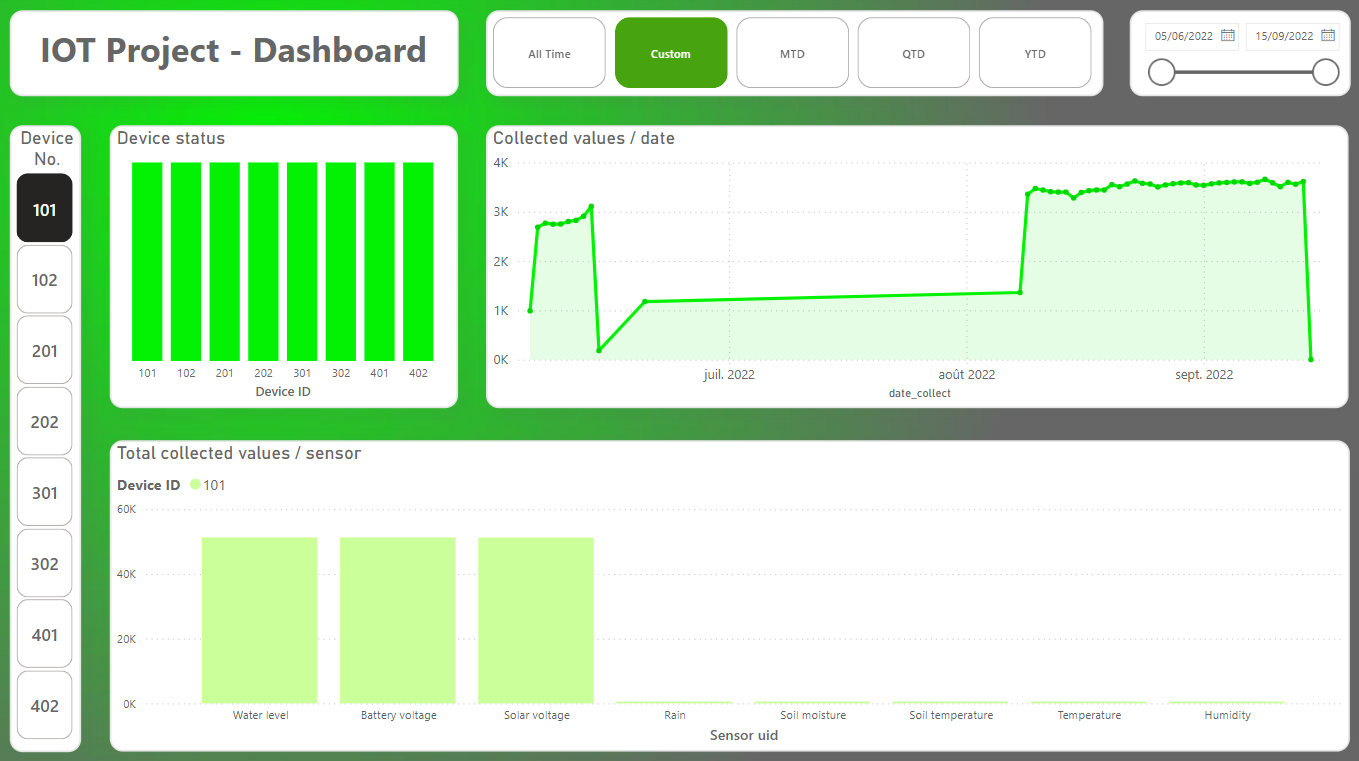
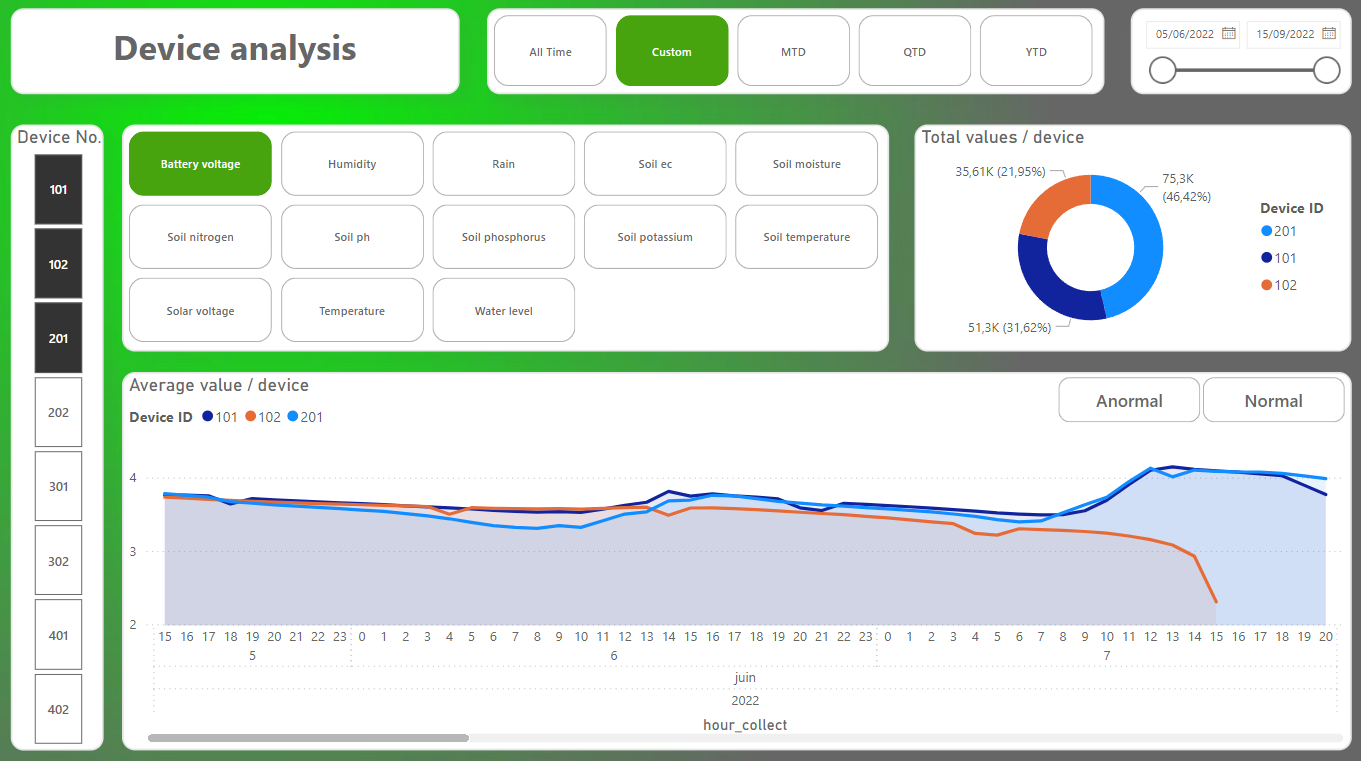
Checking the proper functioning of each device and the number of data collected
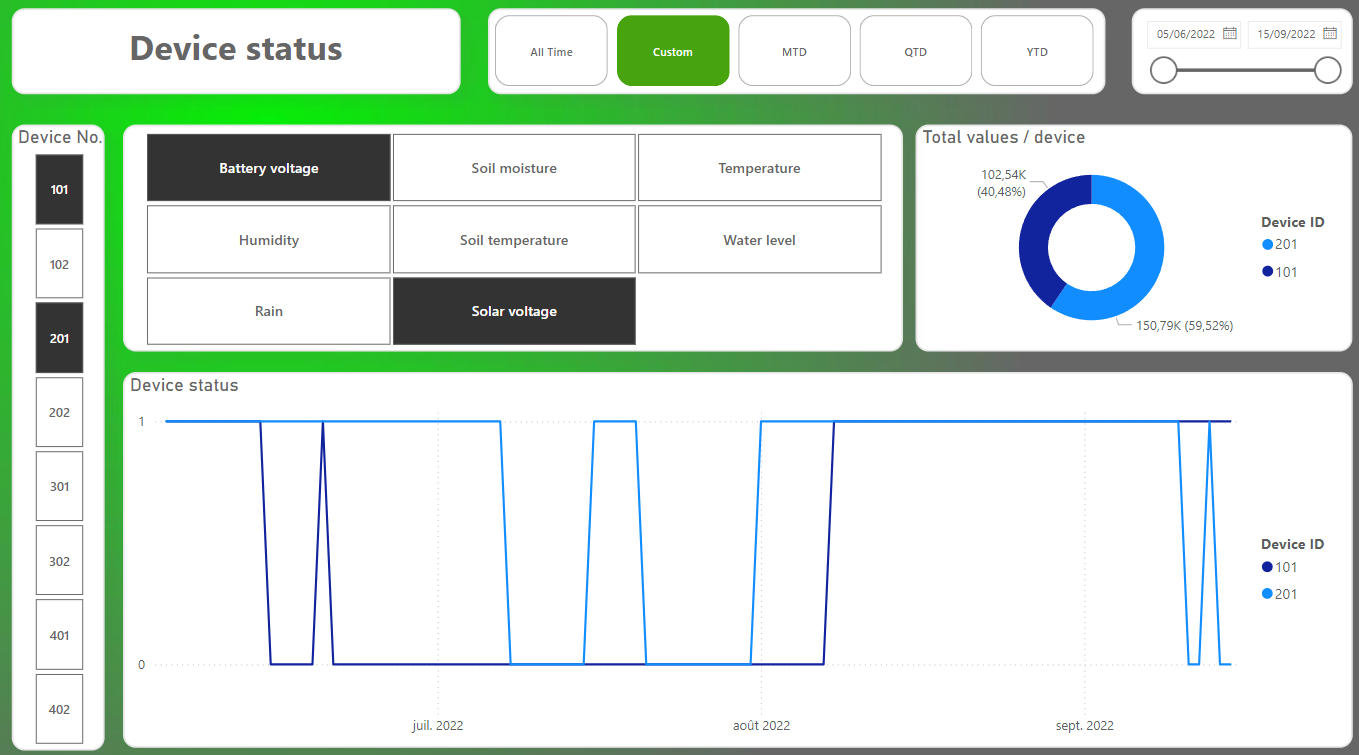
Activity period of each sensor for such device
Graph of data collected for different sensors
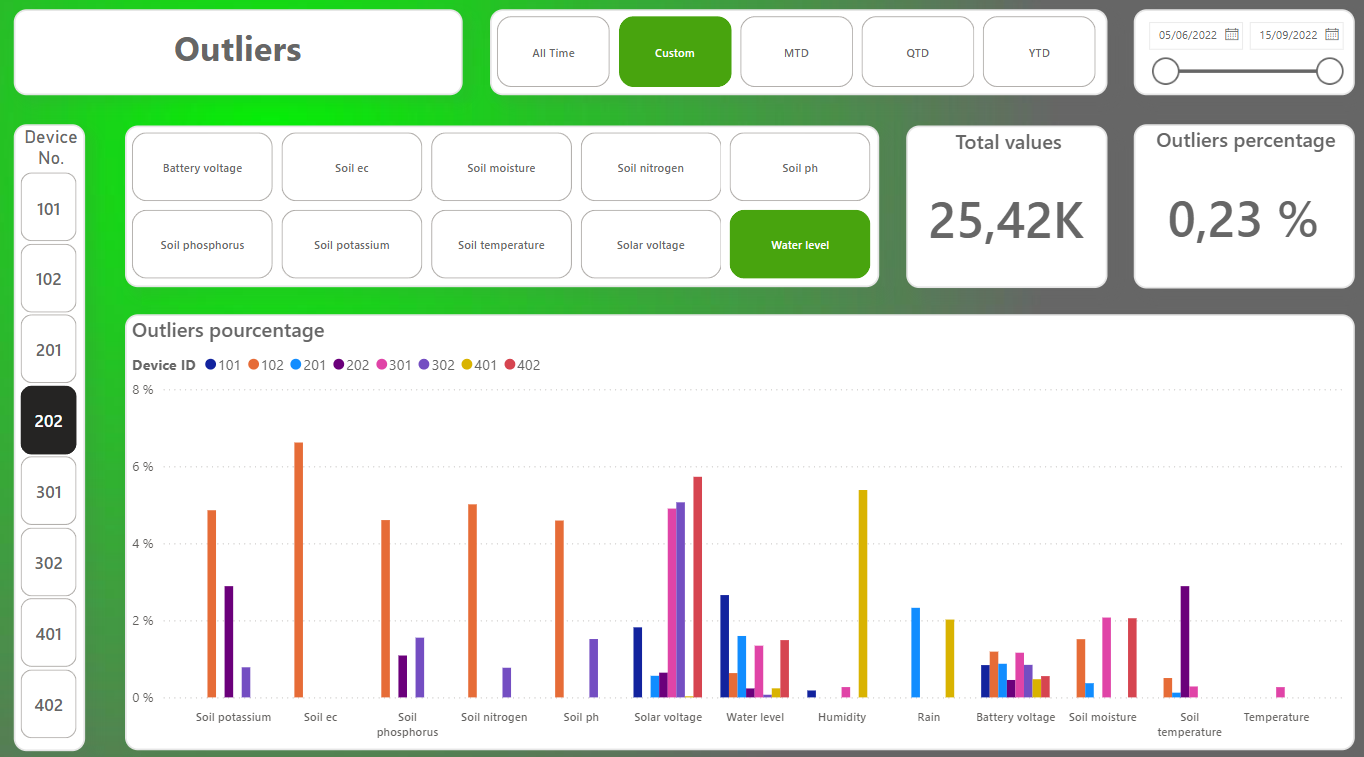
Quantification of outlier data
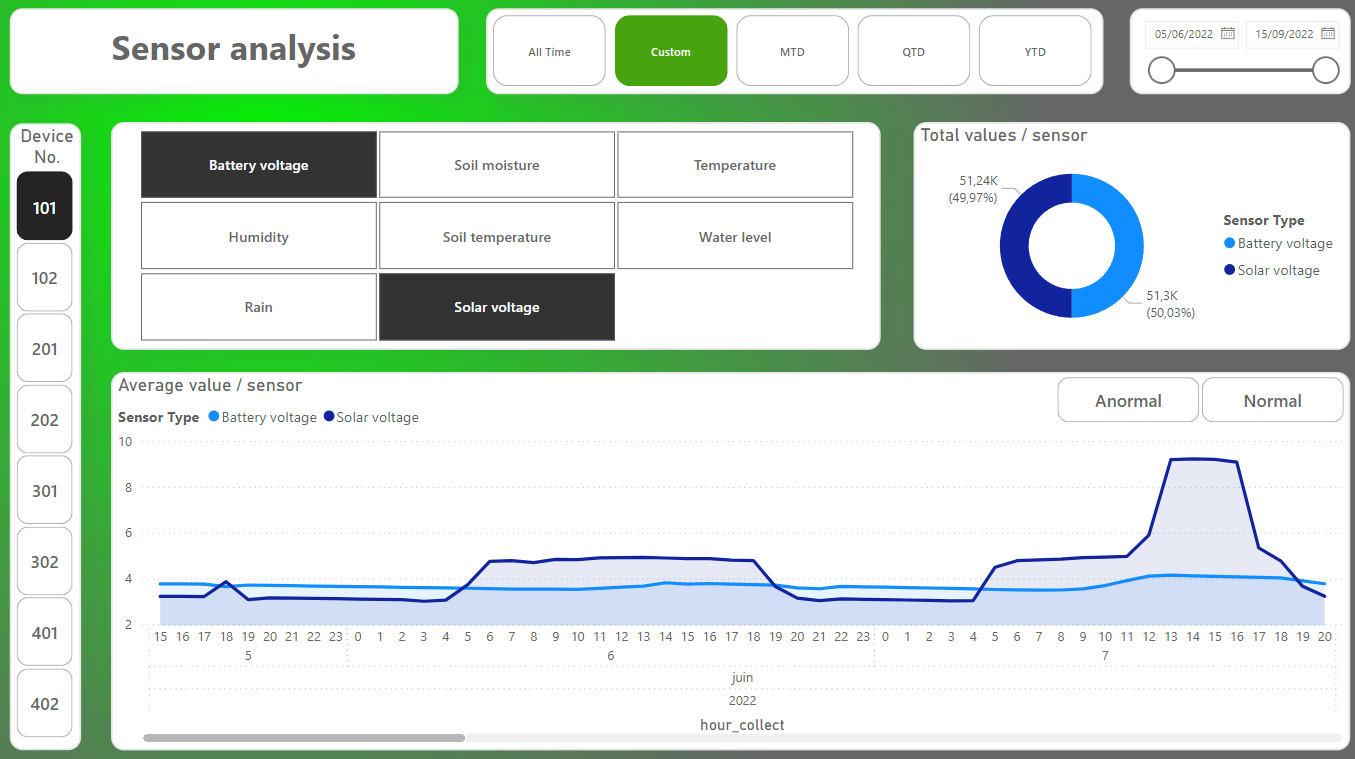
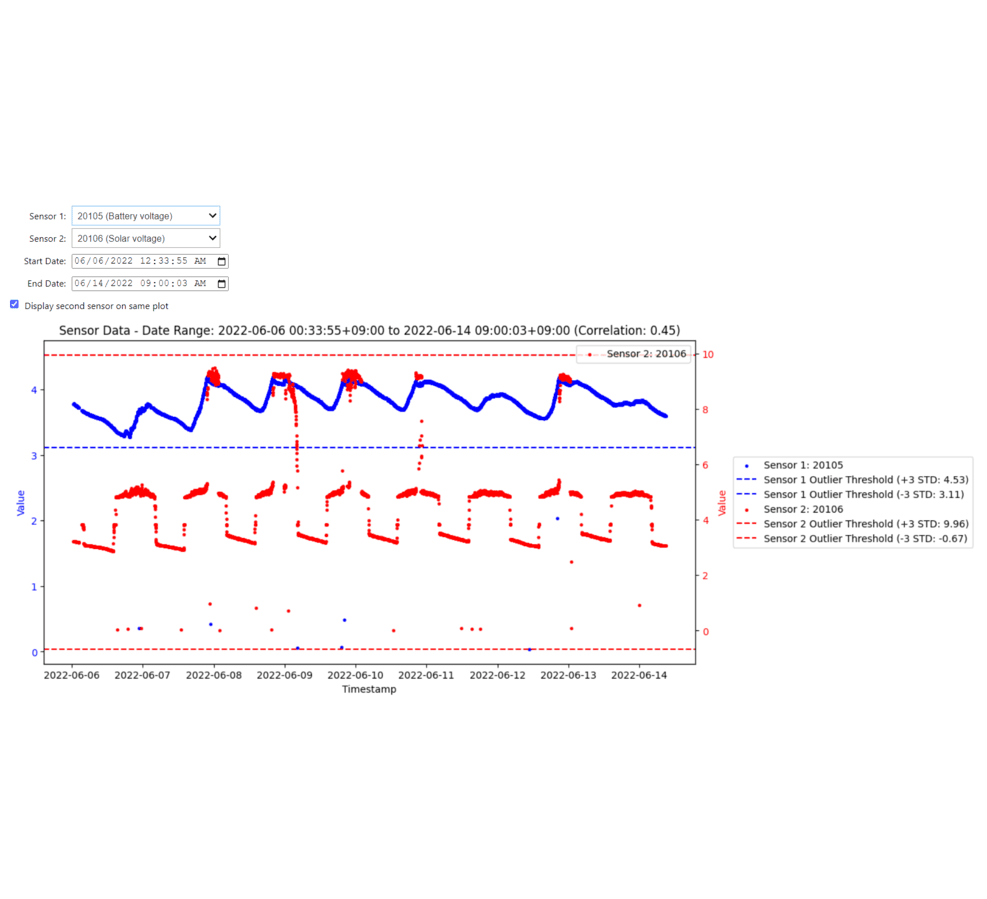
Graphs to compare two sensors on two separate scales
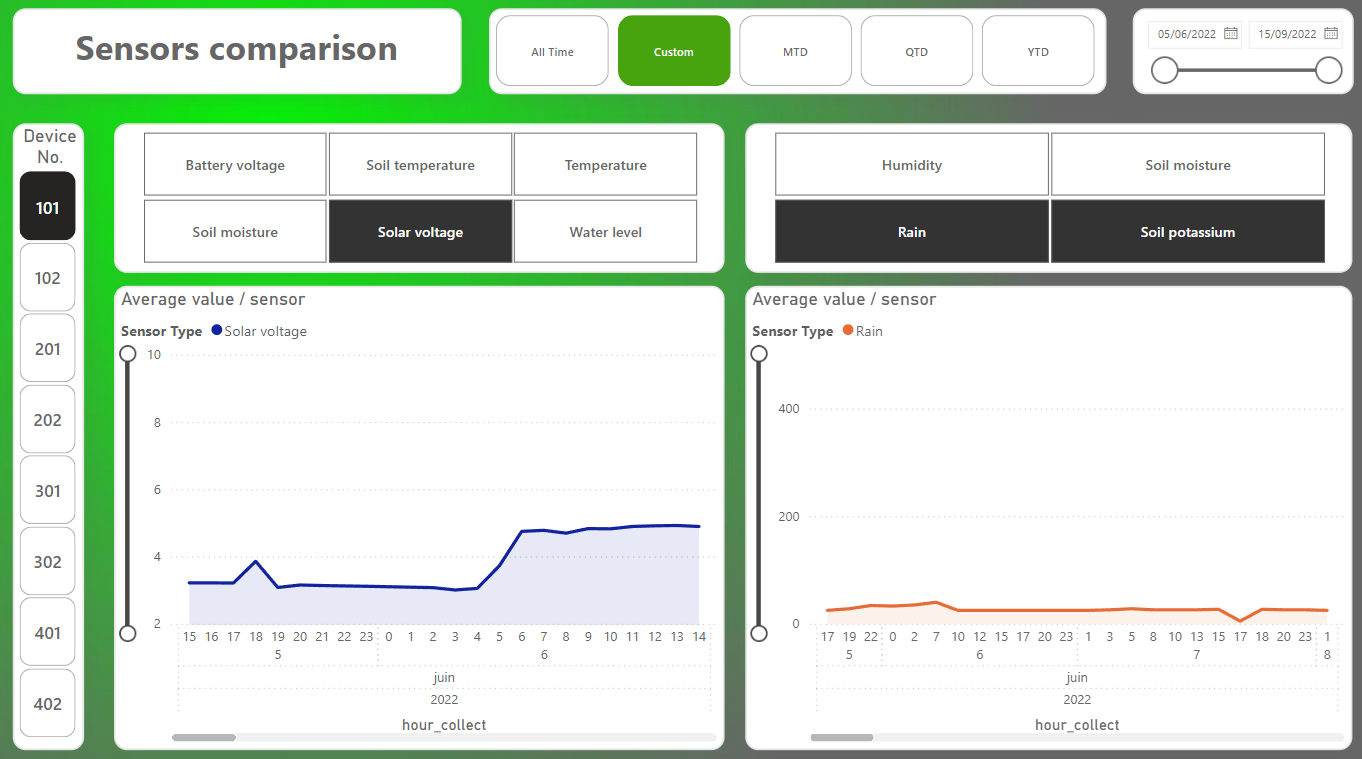
Comparing data from the same type of sensors on different devices
Python
Dashboard
Display of different sensors on the same graph
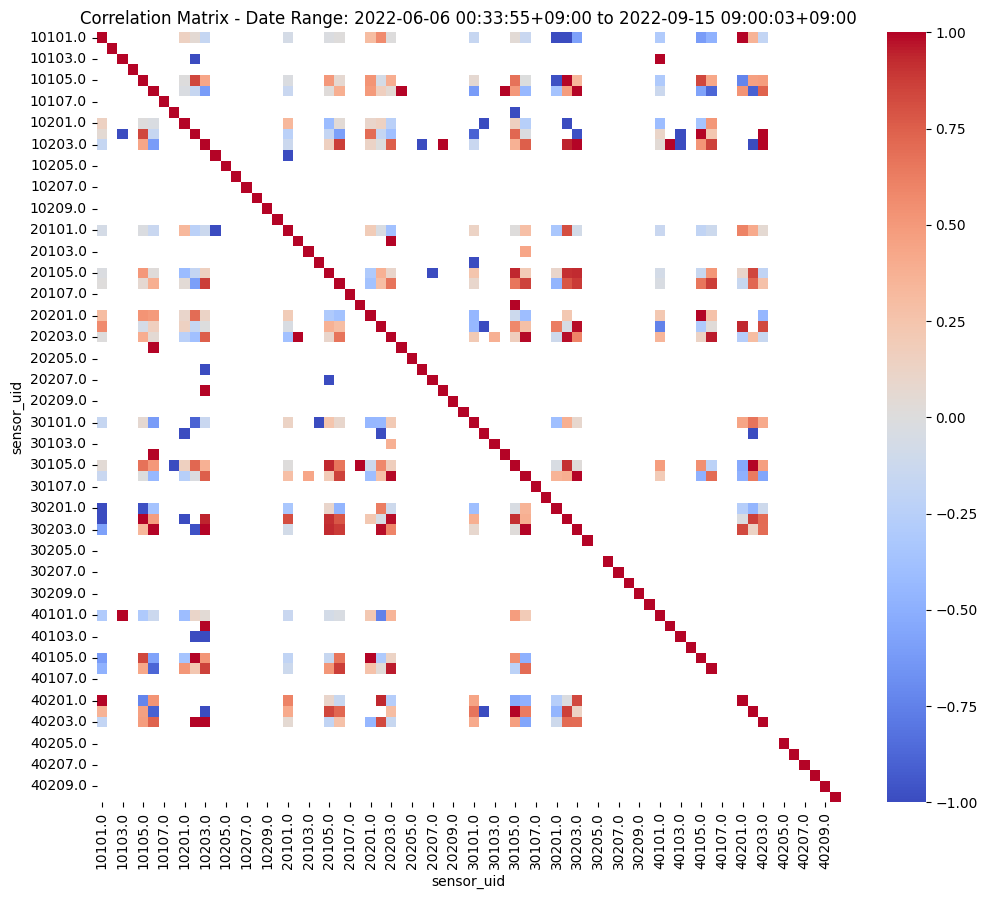
Heatmap of correlation between sensors
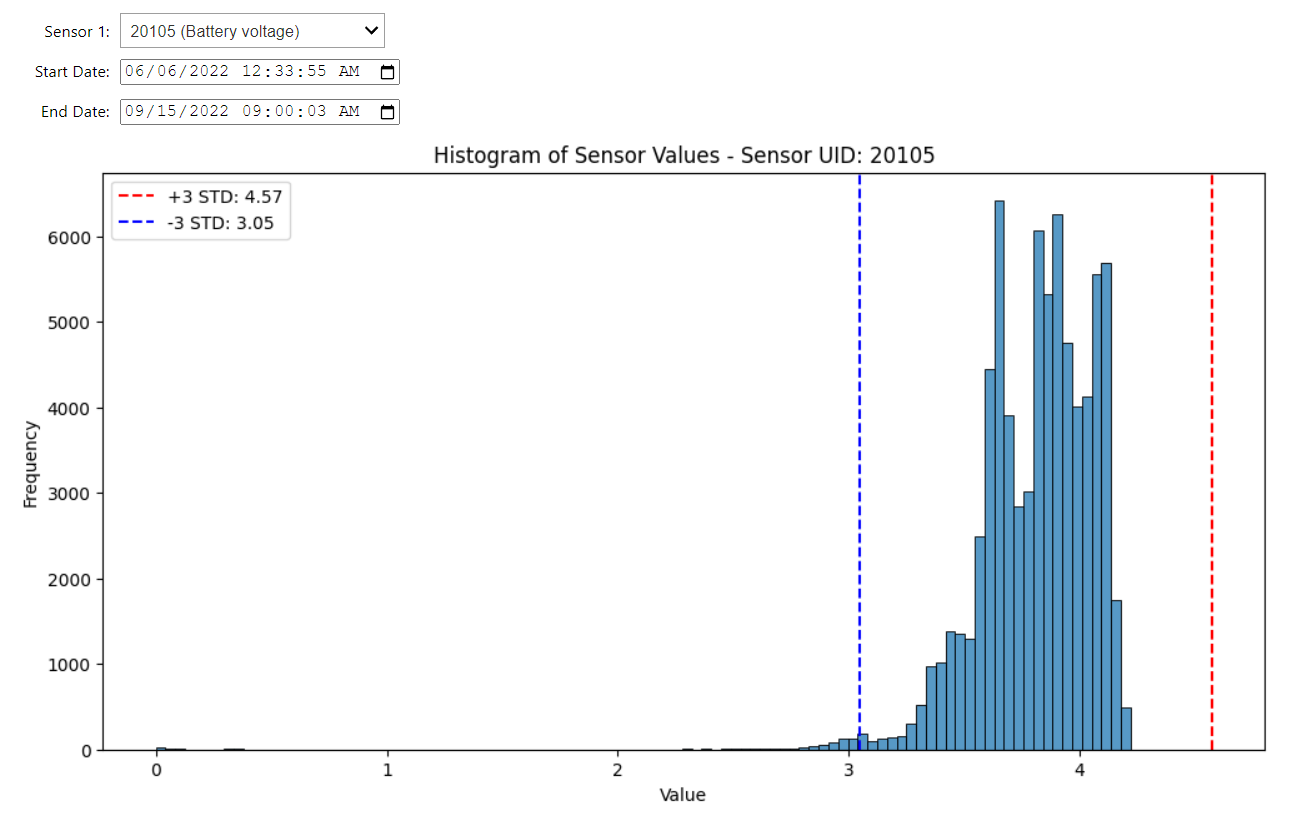
Data sensor histogram
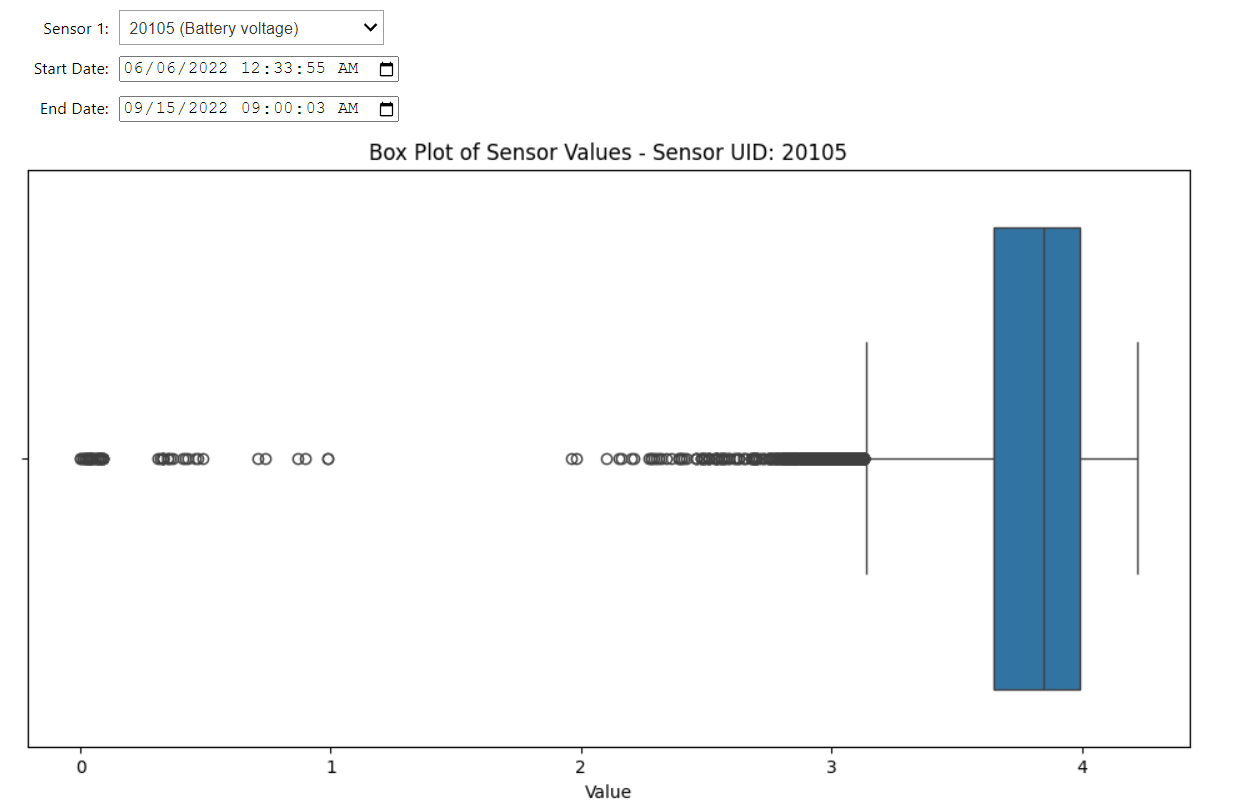
Data sensor boxplot